Tools for inSelf Yoga Series- 4: Sun/ Moon Energy- Variation within a year
Even though they are analytical, some of the genres are interlinked. Eg: Nadi, Chakra, Kundalini, Higher conscious states → all are linked.
This is the master database of all Tools for the inSelf Yoga Series
This is a direct Sequel to Tools for inSelf Yoga Series- 3: Sun/ Moon & External thoughts/ noise Energy variation within a day
Keynote:
Irrespective of the weather conditions and sun-moon energy combination, one has to practice consistently through all the phases of up and down.
These are just tools or map guides to give a practitioner what to expect down the road, one has no control to change anything down the lane than to adapt to it and to get the best out of it.
Importance of Sun-Moon Energy:
- Sun energy in the air is the most critical for yogic purposes, as it can elevate the practitioner's subtle body during breath infusion to very high subtle realms.
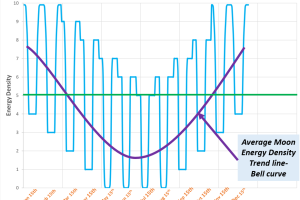
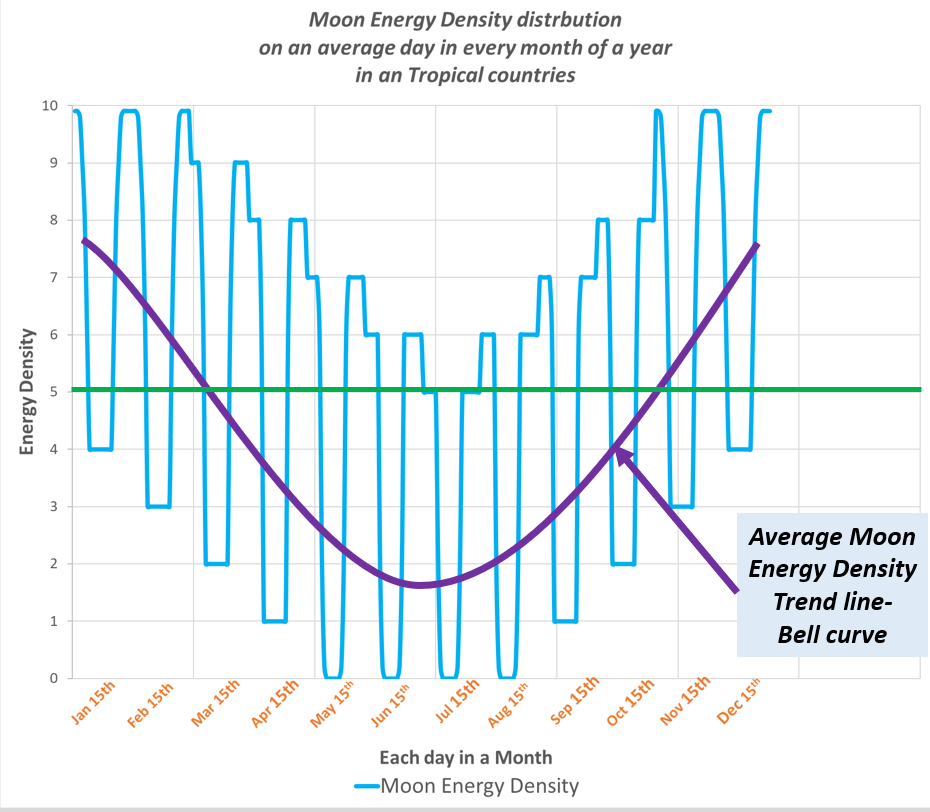
- Moon energy also has a certain importance like sleep, repair, and kundalini maintenance of the body. This energy tends to keep the subtle body closer to earth frequencies.
- For yogic practitioners, solar energy in the air is more critical, and adapting a lifestyle in an advantageous position to harness the maximum solar energy is critical.
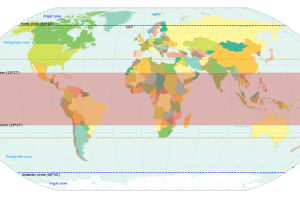
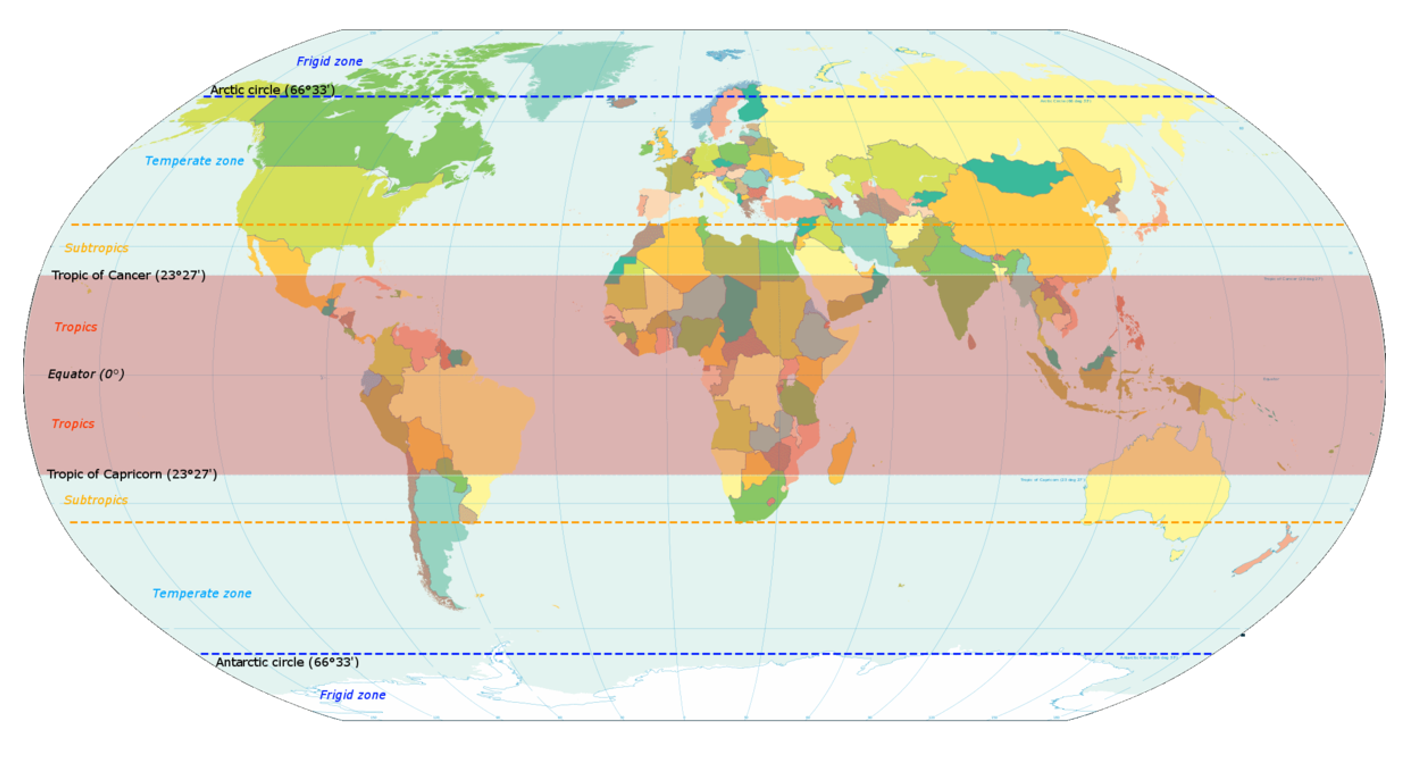
- Areas like tropical or sub-tropical tend to have more sun than Arctic or temperate zones with respect to sun energy only. But we don't get to choose the area of living, our karmic equations move us around the places, so it is necessary to adopt our yogic practice to where Prakriti or nature wants us to be situated.
Purpose of the graphs:
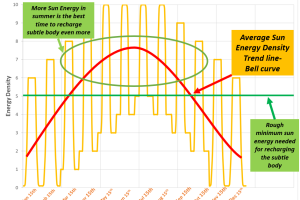
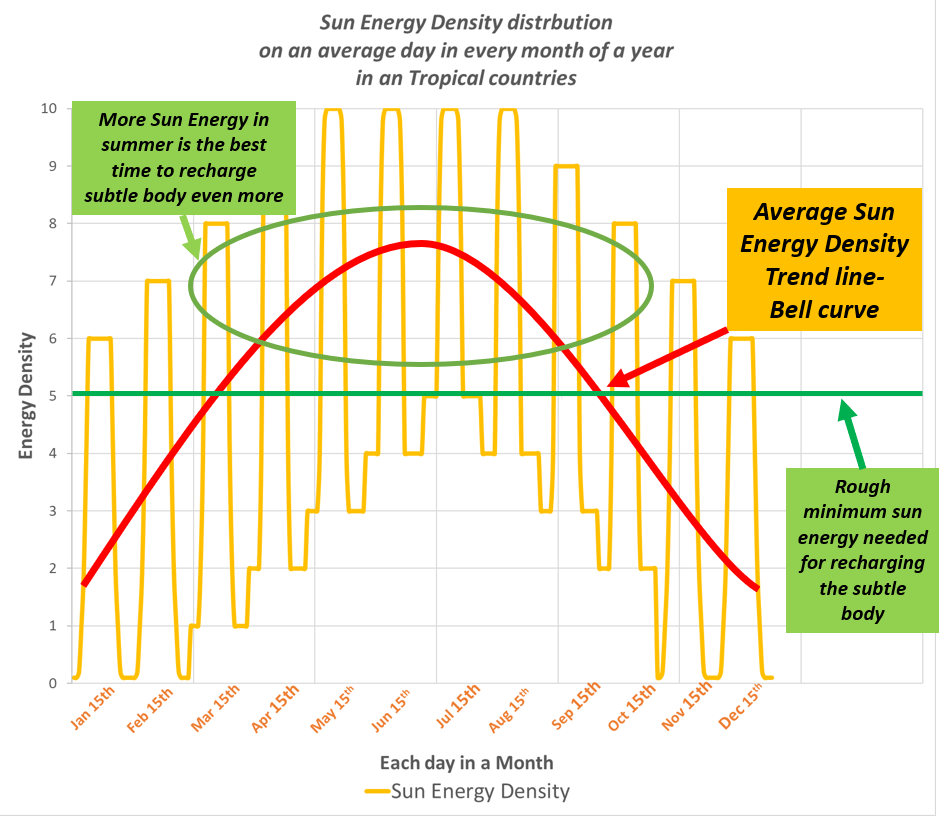
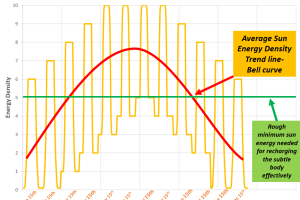
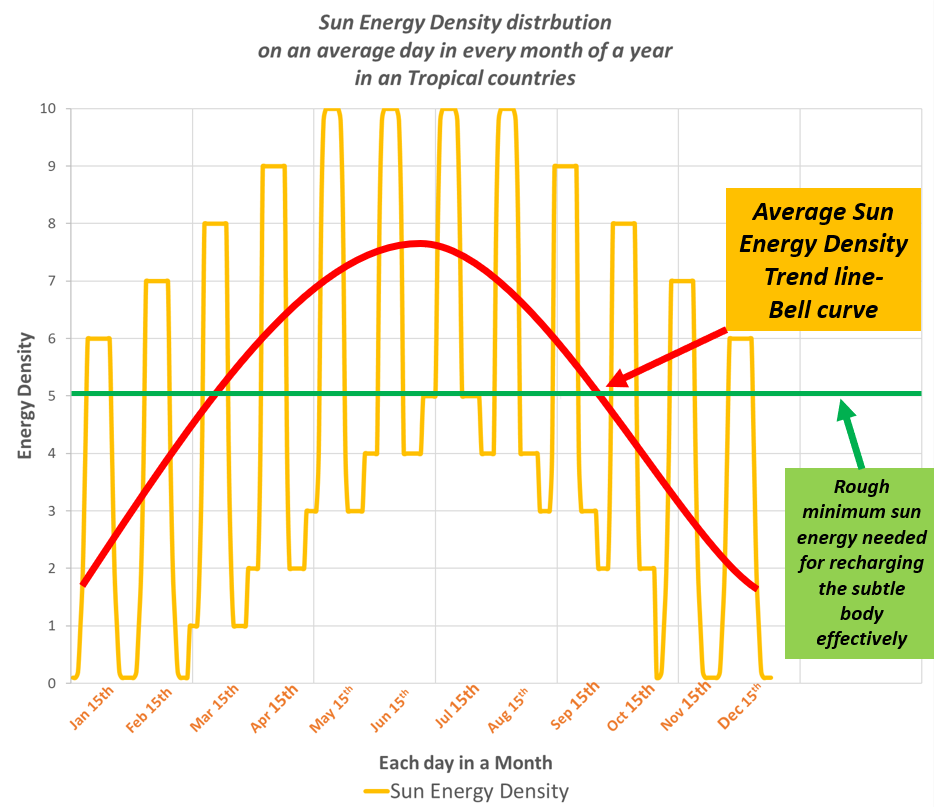
- These graphs show the bell curve trend of how the sun and moon energy distribution happens over a period of the year by taking an average day in each month.
- In summer, the day gets longer and tends to have more solar energy when compared to winter days
- This equips the practitioners to adapt to the seasonal change with the amount of solar energy available in the air with respect to their locality
- The graphs I put below are reasonably good only for sub/ Tropical Zones. For countries like Norway, and Canada, these graphs will not hold well, in fact, everything will be in the reverse of what I portrayed here.
- Understanding the bell curve of weather patterns is critical. In nature, almost every non-linear operation can be represented scientifically by a bell curve.
- In engineering, the peak or bottom of the bell is where we tend to optimize the system to run at those conditions for maximum efficiency. (just an FYI)

This picture added above is taken from wikipedia is open for free use.